What is SAP BTP and SAP Analytics Cloud (SAC)?
SAP Business Technology Platform (SAP BTP) combines intelligent enterprise applications with database and data management, analytics, integration and extension capabilities into a single platform for both cloud and hybrid environments, including hundreds of prebuilt integrations for SAP and third-party applications. brings.
SAP Analytics Cloud is the Analytics subsegment of SAP BTP. SAP Analytics Cloud solution BI (Business Intelligence) is a platform that combines augmented and predictive analytics and planning capabilities in a single cloud environment. As the analytics layer of SAP's BTP (Business Technology Platform) platform, it supports enterprise-wide advanced analytics.
Analytics Cloud Reporting
SAP Analytics Cloud provides many options and conveniences in reporting. Instead of updating or re-creating documents for regularly created reports, it also provides efficiency in terms of saving and examining ready-made templates and time management. Data can be transferred to reports online via SAP. These reports can also be tracked from the mobile application. In addition, the creation of the mobile application screen can be done in Analytics Cloud.
It becomes a more detailed and easy-to-prepare process with the uploading of reports using live or manual data.
Operations such as data connection, comparison, modeling, management control, visualizations (graphics, etc.), application planning interface can be performed in Analytics Cloud.
Depending on the selection, the data can be processed live or manually, and the desired scenarios and reporting screens can be created depending on these selections.
It is paired with SAP BW, SAP HANA, S4 HANA and SAP BPC.
It can also be used in Google Drive, File server, ODATA.
It can be used as an alternative to Fiori screens.
Who can use Analytics Cloud?
Finance teams, reporting specialists, analysts, planning specialists, application developers and UI5 (Fiori-Java programmers) developers can use programmers.
SAC Architectural Structure
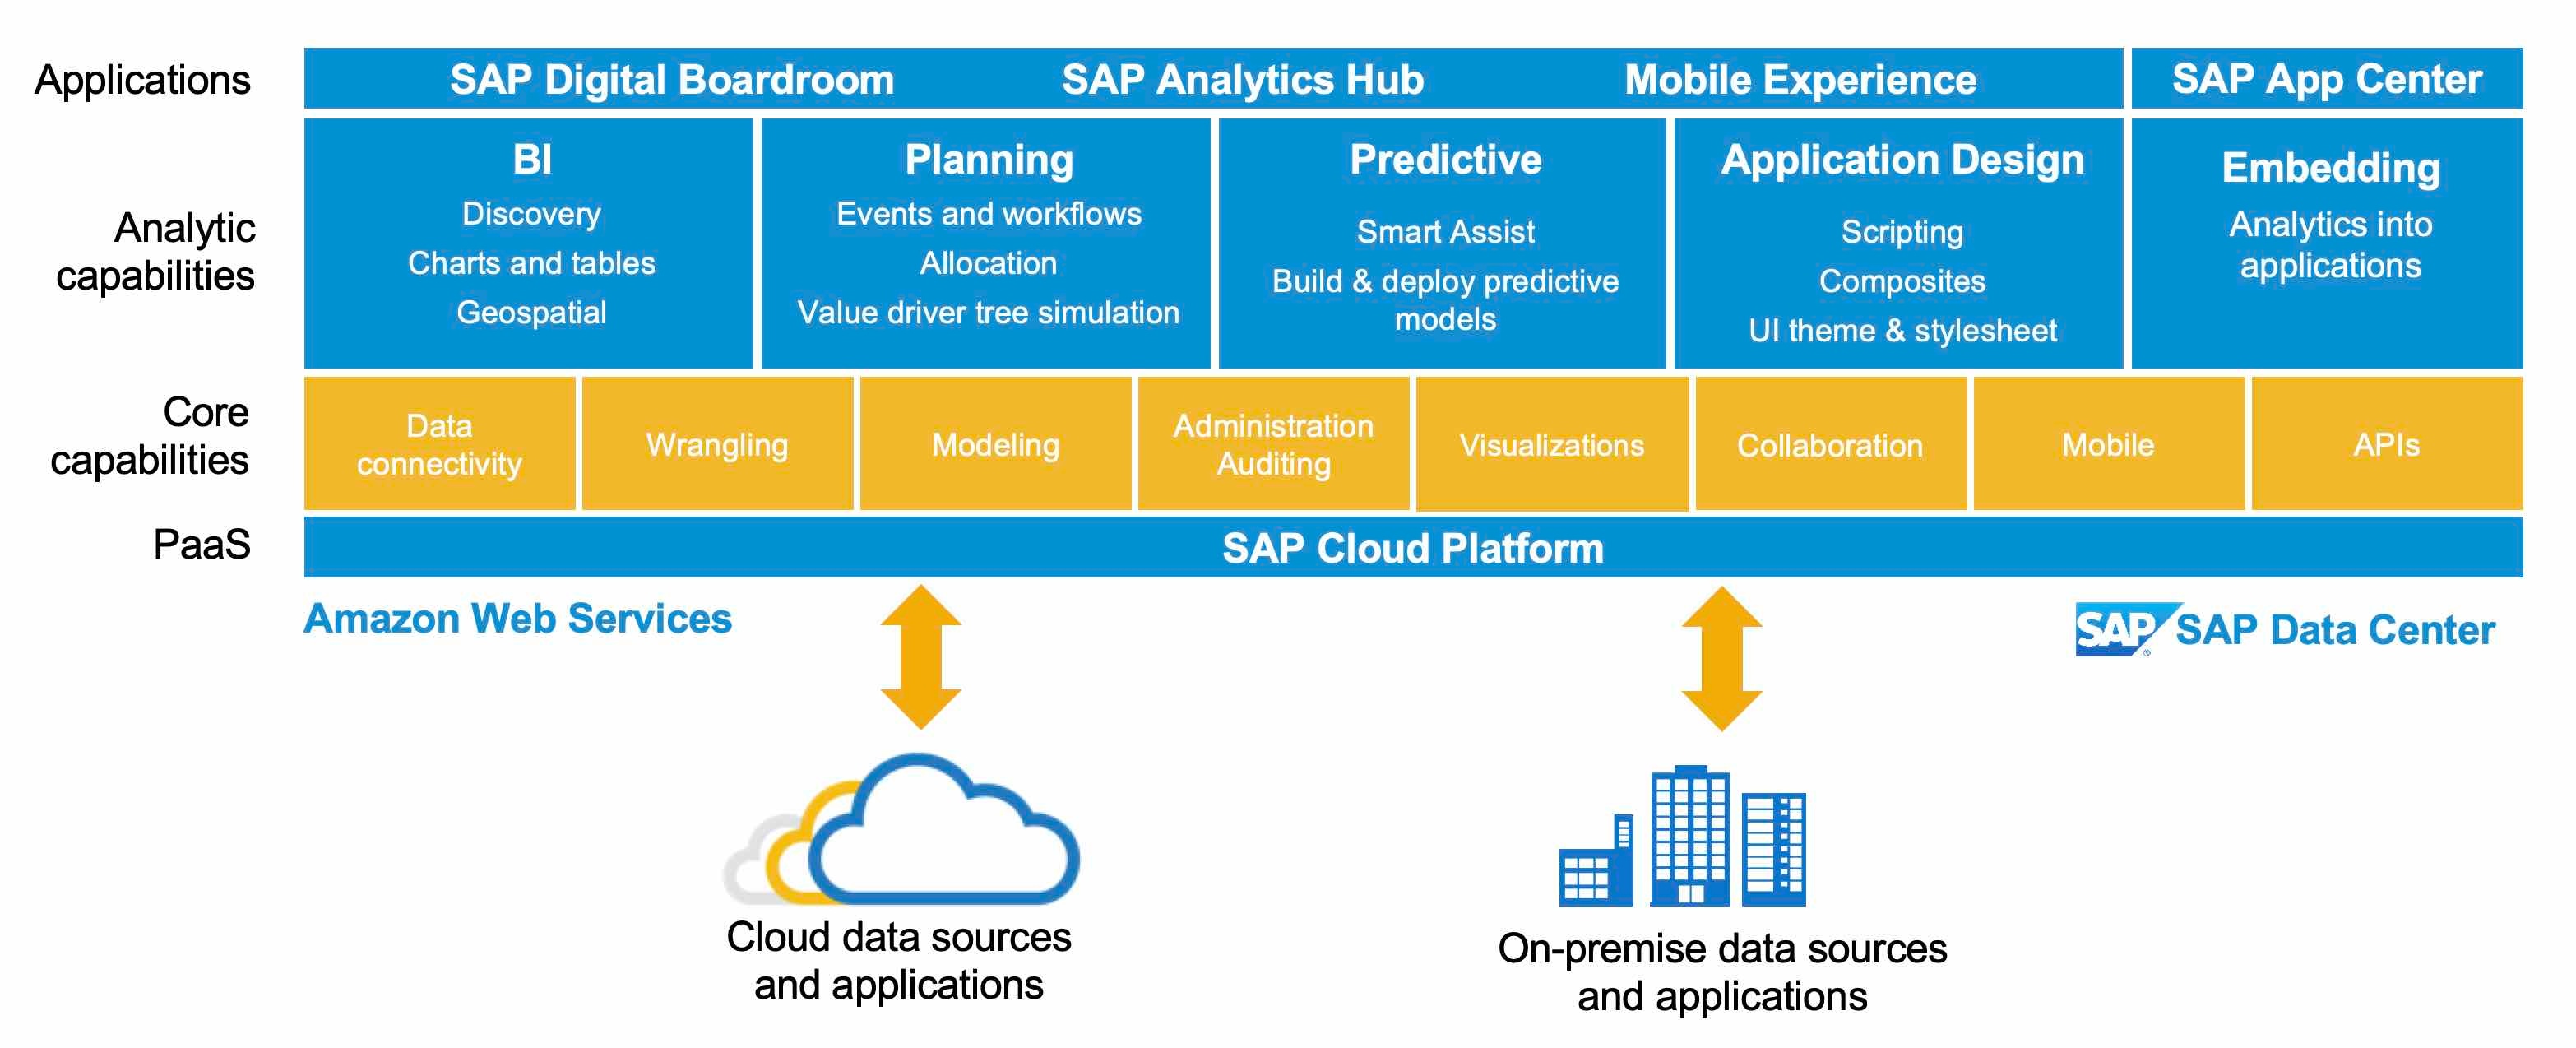
Figure 1. SAP Analytics Cloud Architecture structure
SAP Analytics Cloud Data Entry Screen Example
In the example below, the Excel format that users edit and upload to SAC can be automatically analyzed on Analytics, and accordingly, data such as graphs, ratios, etc. analyzes can be turned into report scenarios (fiction) in desired formats.
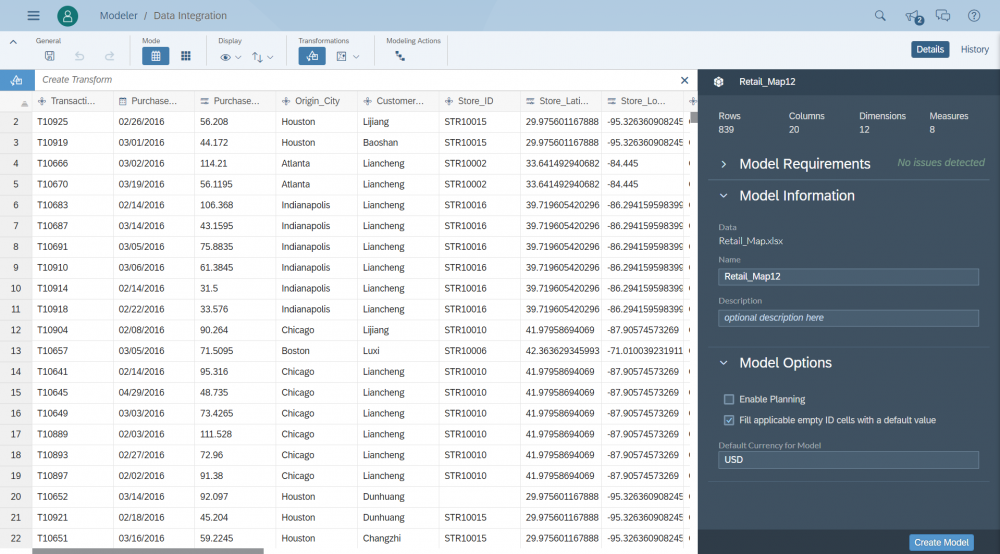
Figure 2. SAP Analytics Cloud screenshot
In the example above, the vote rates of the regions in the elections of the USA, the information of the politicians who voted and the regions where the votes were received are entered. Accordingly, the program automatically makes the data analysis/end for you. Report layout, desired ordering, output layout, etc. provides flexibility.
Introducing Our SAP Experience and Solutions!
You can contact us or request a demo to get more detailed information about our successful SAP projects and experiences with different processes and different customers.